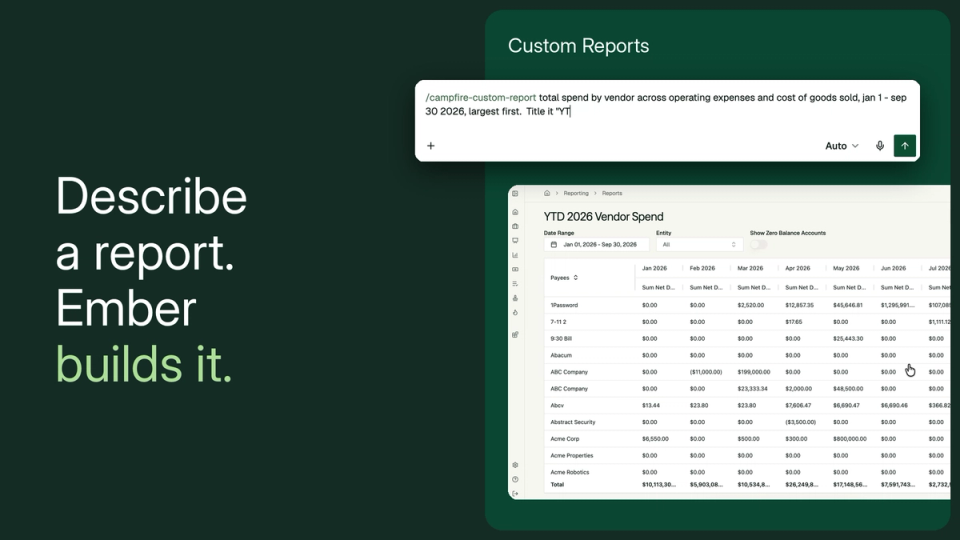
Introducing Custom Dashboards


You can now build your own dashboards in Campfire just by describing them.
I used to build CFO dashboards with general-purpose AI tools. They were quick to make, but they always had limits. The numbers were a model's best guess, I couldn't trace a figure back to the books, and every refresh meant waiting on a new prompt. So we built a native version that closes those gaps. Today it's live in Campfire.
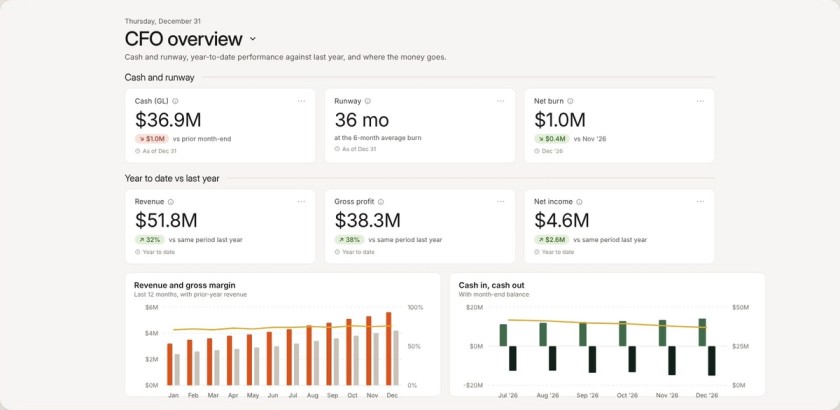
See where you stand, however you want
Tell Campfire what you want to track, and it builds the dashboard on top of your financial data. Revenue by product, AR aging by customer, AI spend by department. Whatever you want to keep a close eye on.

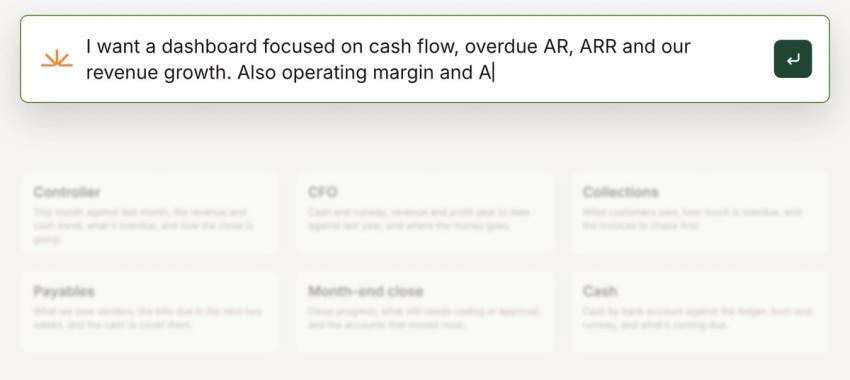
Describe the dashboard you want
Type it the way you'd say it to your team. For example: "I want a dashboard focused on cash flow, overdue AR, ARR and our revenue growth. Also operating margin and AI spend."
Campfire plans the page, writes each metric against your ledger, and lays it out in sections, and you can follow every step as it works. No report builder, no formulas, no waiting on someone else to set it up.

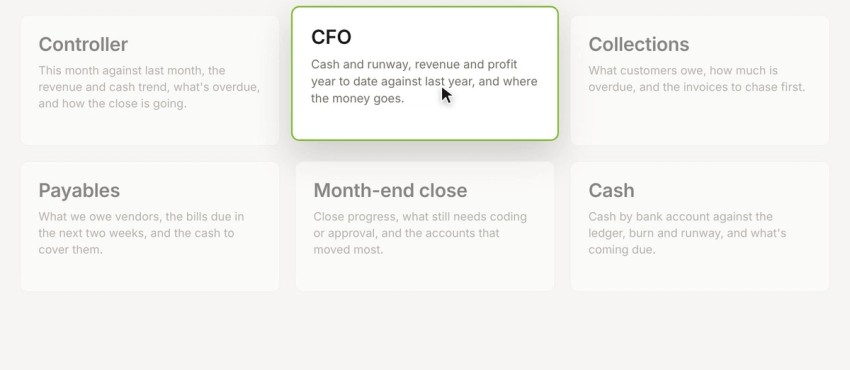
Start from a suggested dashboard for your role
If you'd rather start from something, pick a suggested dashboard for your role: Controller, CFO, Collections, Payables, Month-end close or Cash. Each one opens with the metrics that role checks most, and you can shape it from there.

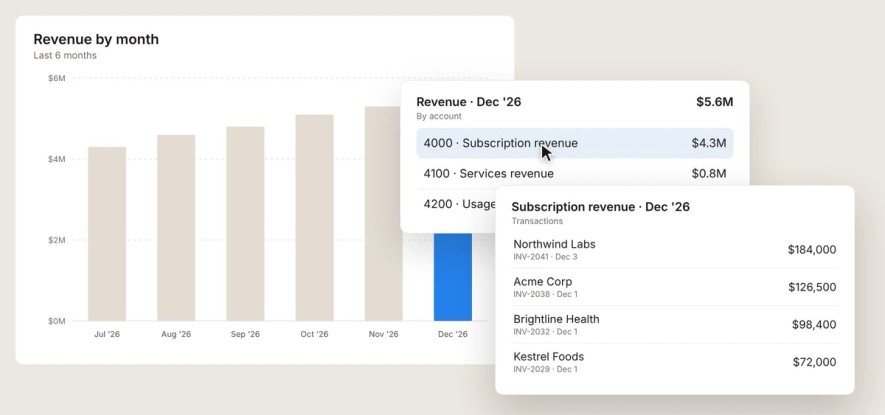
Click into any number
Click any number and go from the chart to the accounts to the individual transactions behind it. When someone on the board asks where a figure came from, the answer is two clicks away.

Switch, edit, or start fresh
Keep as many dashboards as you need and switch between them from one menu. Edit any of them by asking, like "add a tile for invoices due this week," and the new tile appears in place. Start a new one whenever a new question comes up.

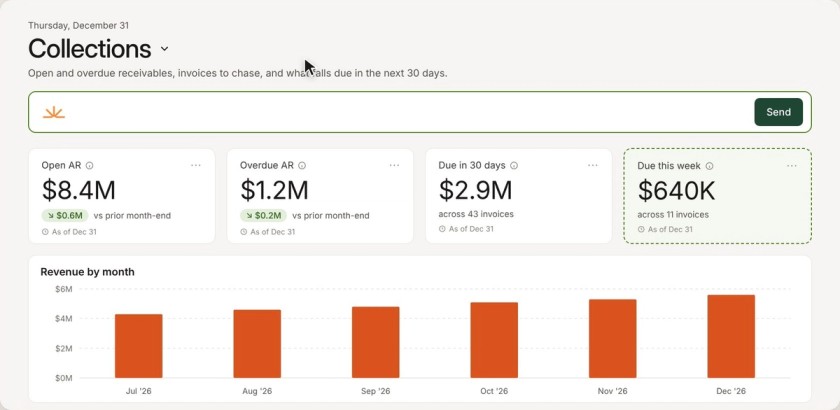
They load right away because they run on Campfire's data layer, not a fresh AI prompt every time you open one. I've already built five in our own Campfire account.
This new era of finance is for builders
Custom Dashboards are for controllers, CFOs, and everyone on the finance team who wants to see where the business stands without waiting on a report. I can't wait to see what you build.
If you're a Campfire customer, open Home and tell it what you want to see. If you're not yet, learn more at campfire.ai.